
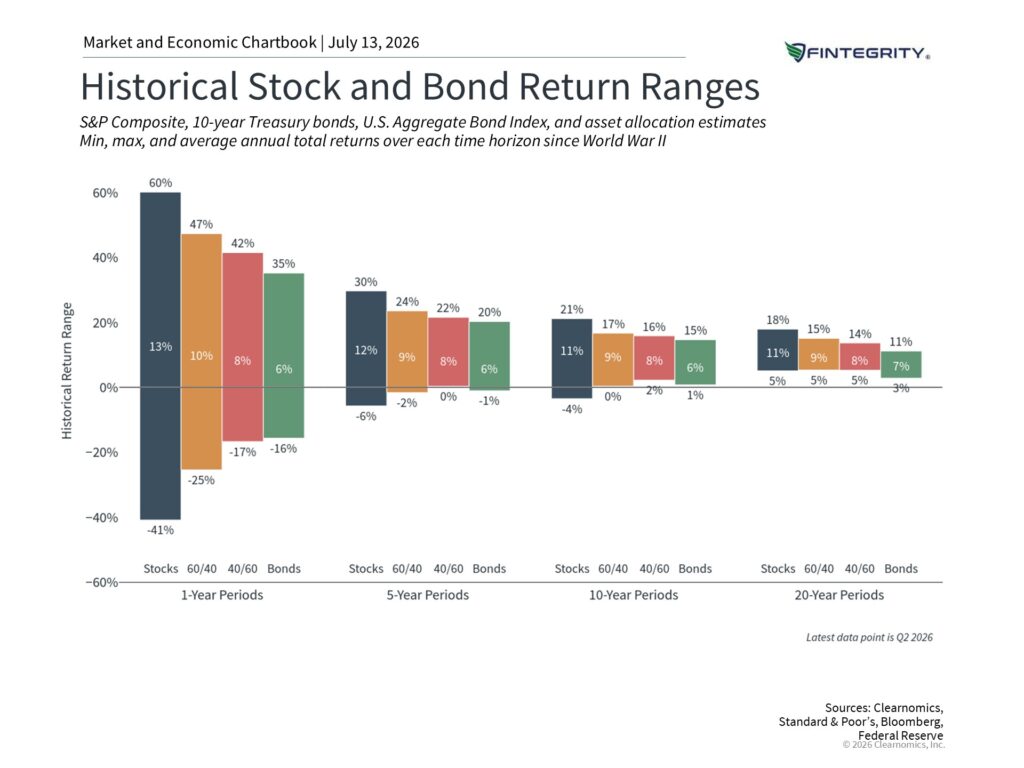
This chart illustrates an essential point for investing: risk isn’t a fixed trait of stocks or bonds. It depends heavily on how long you hold them.
Over a single year, stocks have swung wildly, from up 60% to down 41% since World War II. Stretch the holding period out, and that range narrows sharply. Over 20-year windows in this data, stocks never posted a negative annualized return, and even the weakest stretch earned around 5% a year.
Notice what does not change much: the averages. Stocks averaged roughly 11% across every time horizon, bonds around 6%. Time hasn’t raised the return you’d expect. It has narrowed the range of what can happen along the way.
That points to two questions worth asking before you settle on a mix.
When will you need the money? Match the money to the calendar. Funds you’ll spend in the next year or two don’t belong in stocks, because a sharp drop right before you withdraw leaves no time to recover. Money you won’t touch for fifteen or twenty years can hold more stock, since history suggests time has smoothed the ride.
How would you handle a bad year? The right allocation is the one you’ll actually hold when markets fall. The larger danger isn’t a temporary paper loss. It’s selling near the bottom and missing the recovery. A steadier blend you can stick with often beats an aggressive one you’d abandon.
The trade-off is real. Adding bonds cushioned the worst years and calmed the swings. It also trimmed the strongest years and lowered long-run growth. Neither side is free.
About this chart. The bars show the historical range of annual returns for the S&P Composite Index, bonds, and blended portfolios of the two, across 1-, 5-, 10-, and 20-year holding periods. The 60/40 blend holds 60% stocks and 40% bonds, and the 40/60 blend holds 40% stocks and 60% bonds. For each asset or blend, the bar marks the minimum, maximum, and average annual return over that period. Returns are built from underlying monthly total returns. For periods longer than a year, annual figures use geometric means. The bond index reflects 10-year U.S. Treasury bonds before 1976 and the Bloomberg U.S. Aggregate Bond Index from 1976 forward. Data covers 1945 through June 30, 2026.
Past performance does not guarantee future results. This material is for educational purposes and is not investment advice or a recommendation. Blended allocations are hypothetical and assume periodic rebalancing.